Abstract
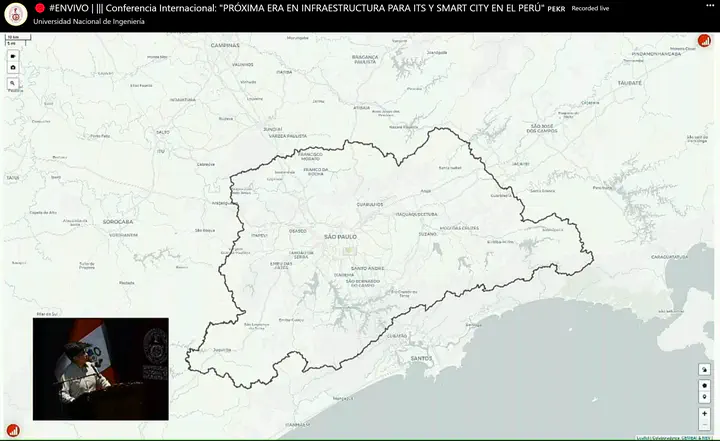
Big cities typically present a high volume of crimes ranging from petty thefts to homicides. Moreover, the type and pattern of crimes change considerably around the cities, usually presenting regions where crimes are more frequent and typically accompanied by gratuitous violence. São Paulo (the largest city in South America) bears high criminality rates with great variability in patterns of crimes, even in geographically close regions. These characteristics make glyph-based crime mapping completely unsuitable for analyzing crimes. So, in this context, arises the demand for visualization assisted analytical tools customized to support the analysis of criminal activities in urban areas with the characteristics of a city such as São Paulo. These analytical tools have to be able to compare and analyze crime rate variations, reveal crime patterns and hotspots (with different levels of details) while they still allow uncovering their temporal dynamics and relation with infrastructure and social factors.